Important note: we use only cross-platform Open Source Software and Open Datasets for our publications. You can freely download all the used software and data.
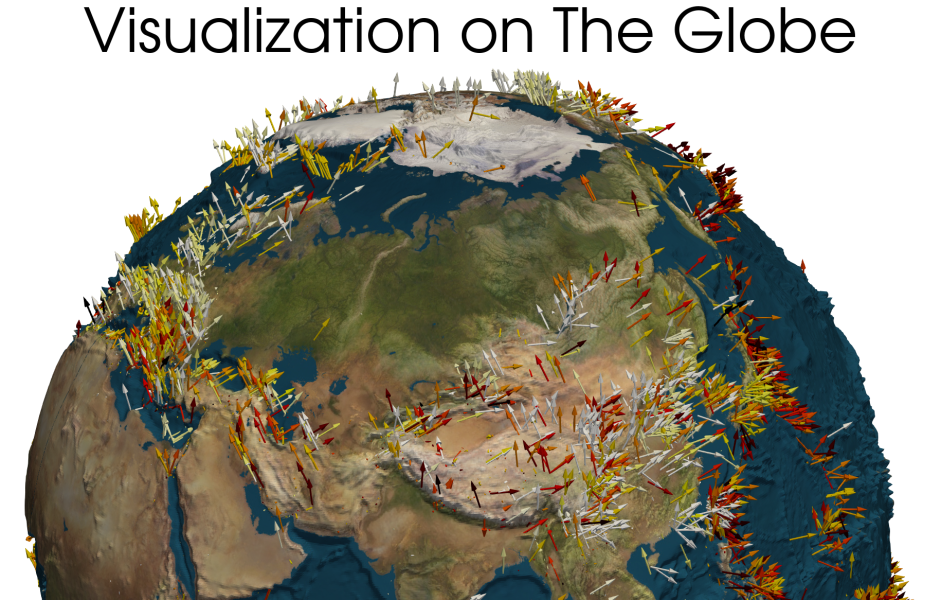
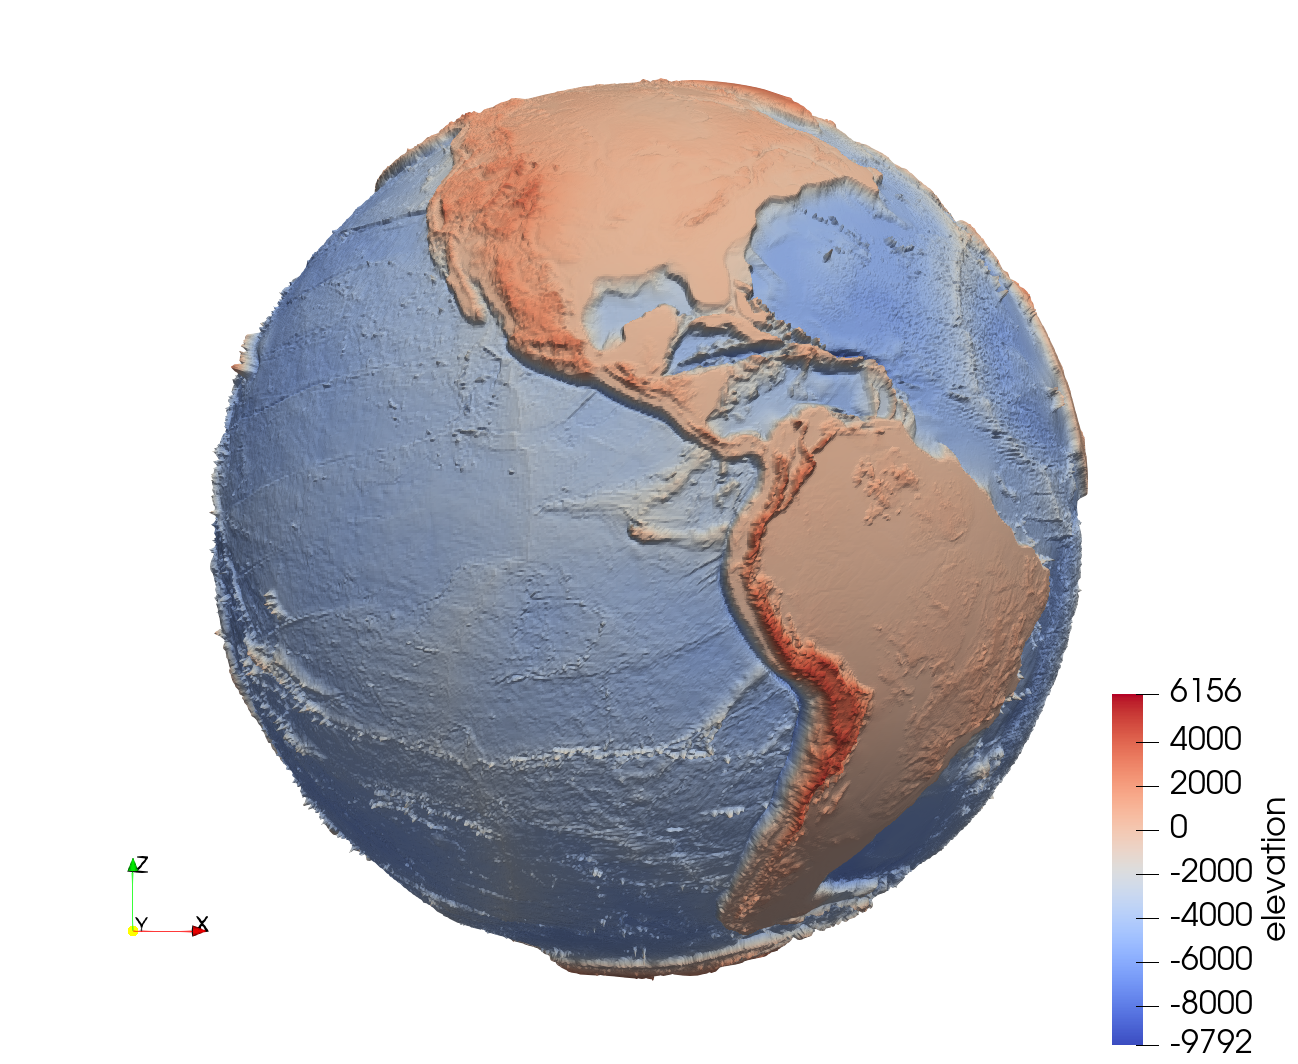
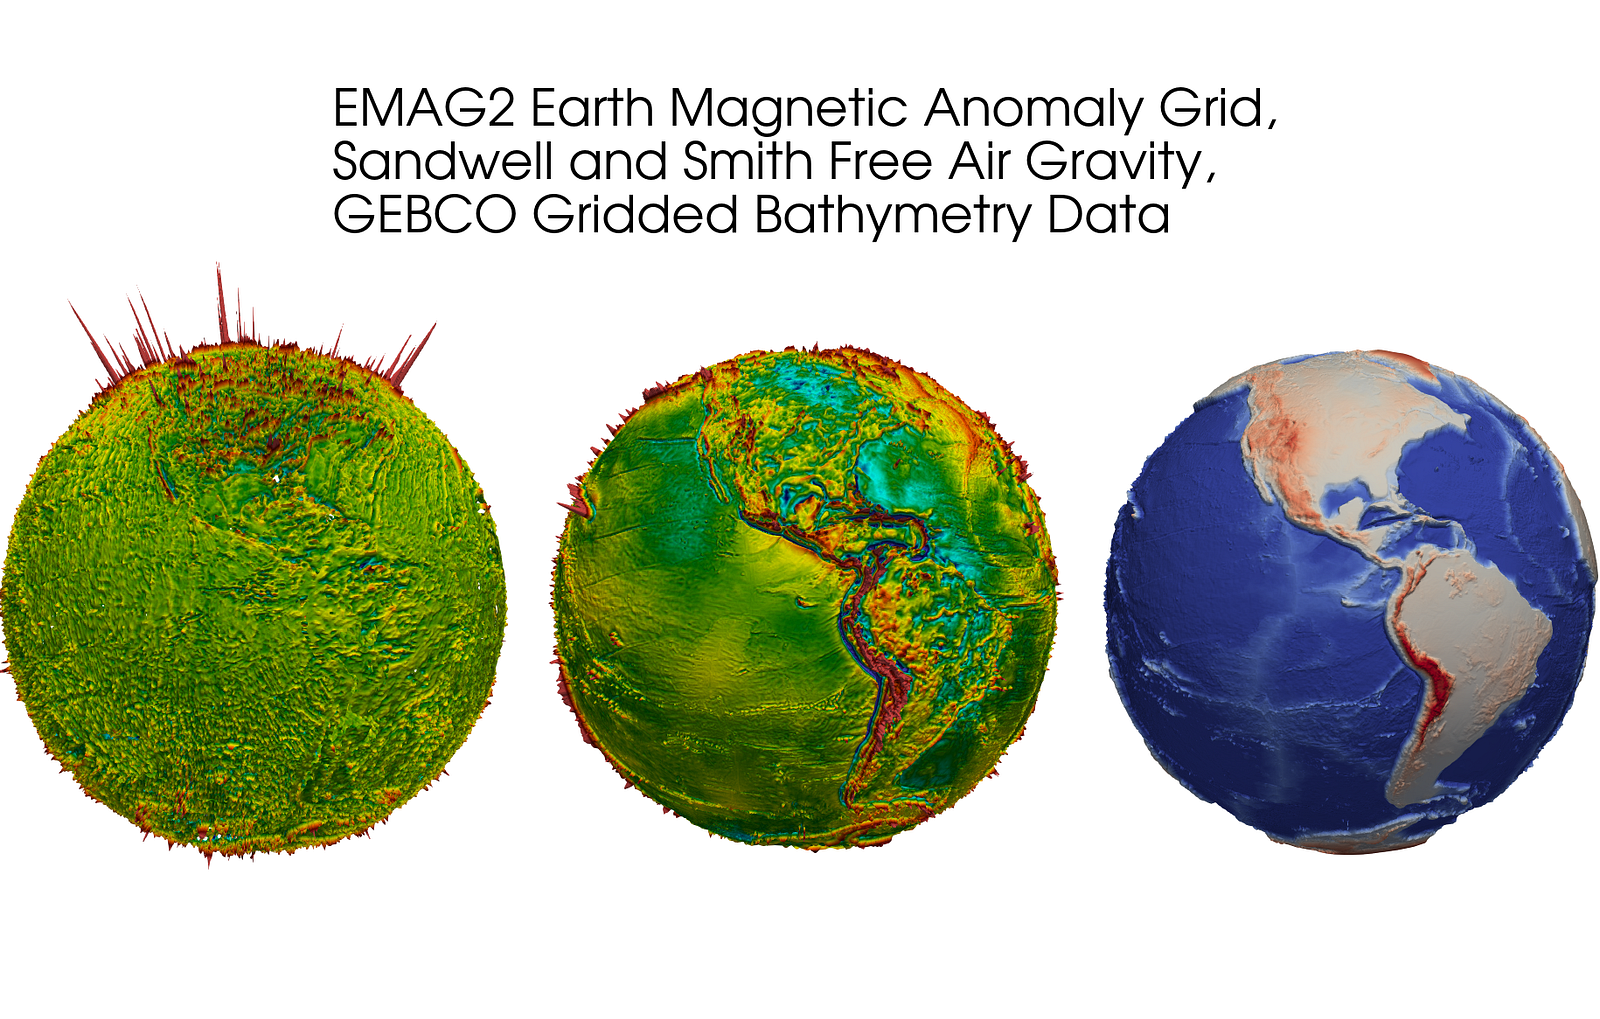
These are our commonly used datasets in the same order as on the picture above:
That’s very helpful to produce a high-quality visualization for each of them to present our projects results.ParaViewis the right tool to do it and we need to prepare the source data.
Prepare datasets
1.1. Prepare georasters
The original data grids are too large and that’s better to reduce the sizes. Also, only NetCDF files can be easy processed inParaViewby this way and so we convert the datasets to this format too.GDAL toolis suitable for the conversion:
gdal_translate -of NetCDF -r average -tr .25 0.25 EMAG2_V2.tif EMAG2_V2.15min.nc
gdal_translate -of NetCDF -r average -tr .25 0.25 grav_28.1.nc grav_28.1.15min.nc
gdal_translate -of NetCDF -r average -tr .25 0.25 GEBCO_2019.nc GEBCO_2019.15min.nc
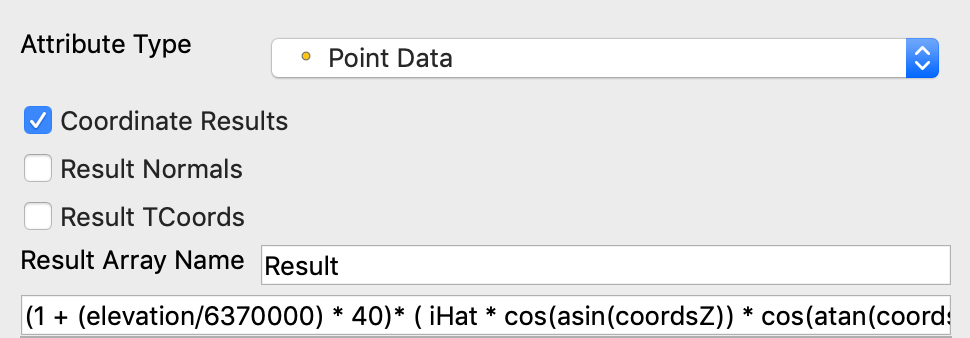
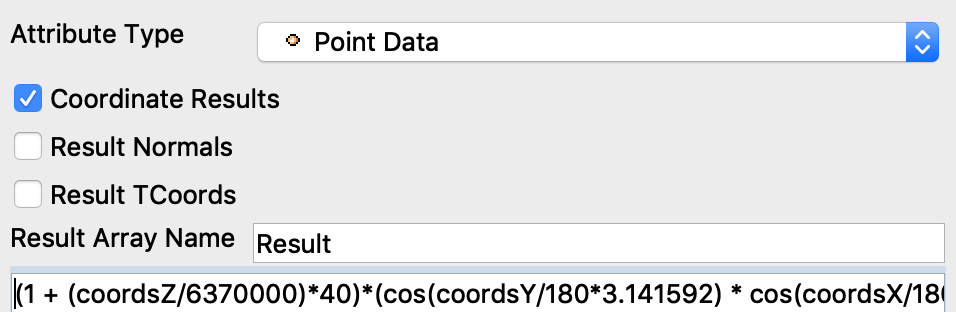
Here “40” is vertical scale factor for better visualization. We converted cell array “elevation” to “Point Data” on the previous step and so we use “Attribute Type”=”Point Data” (the calculation doesn’t work for “Cell Data”). “Coordinate Results” option allows to rewrite the existing coordinates.
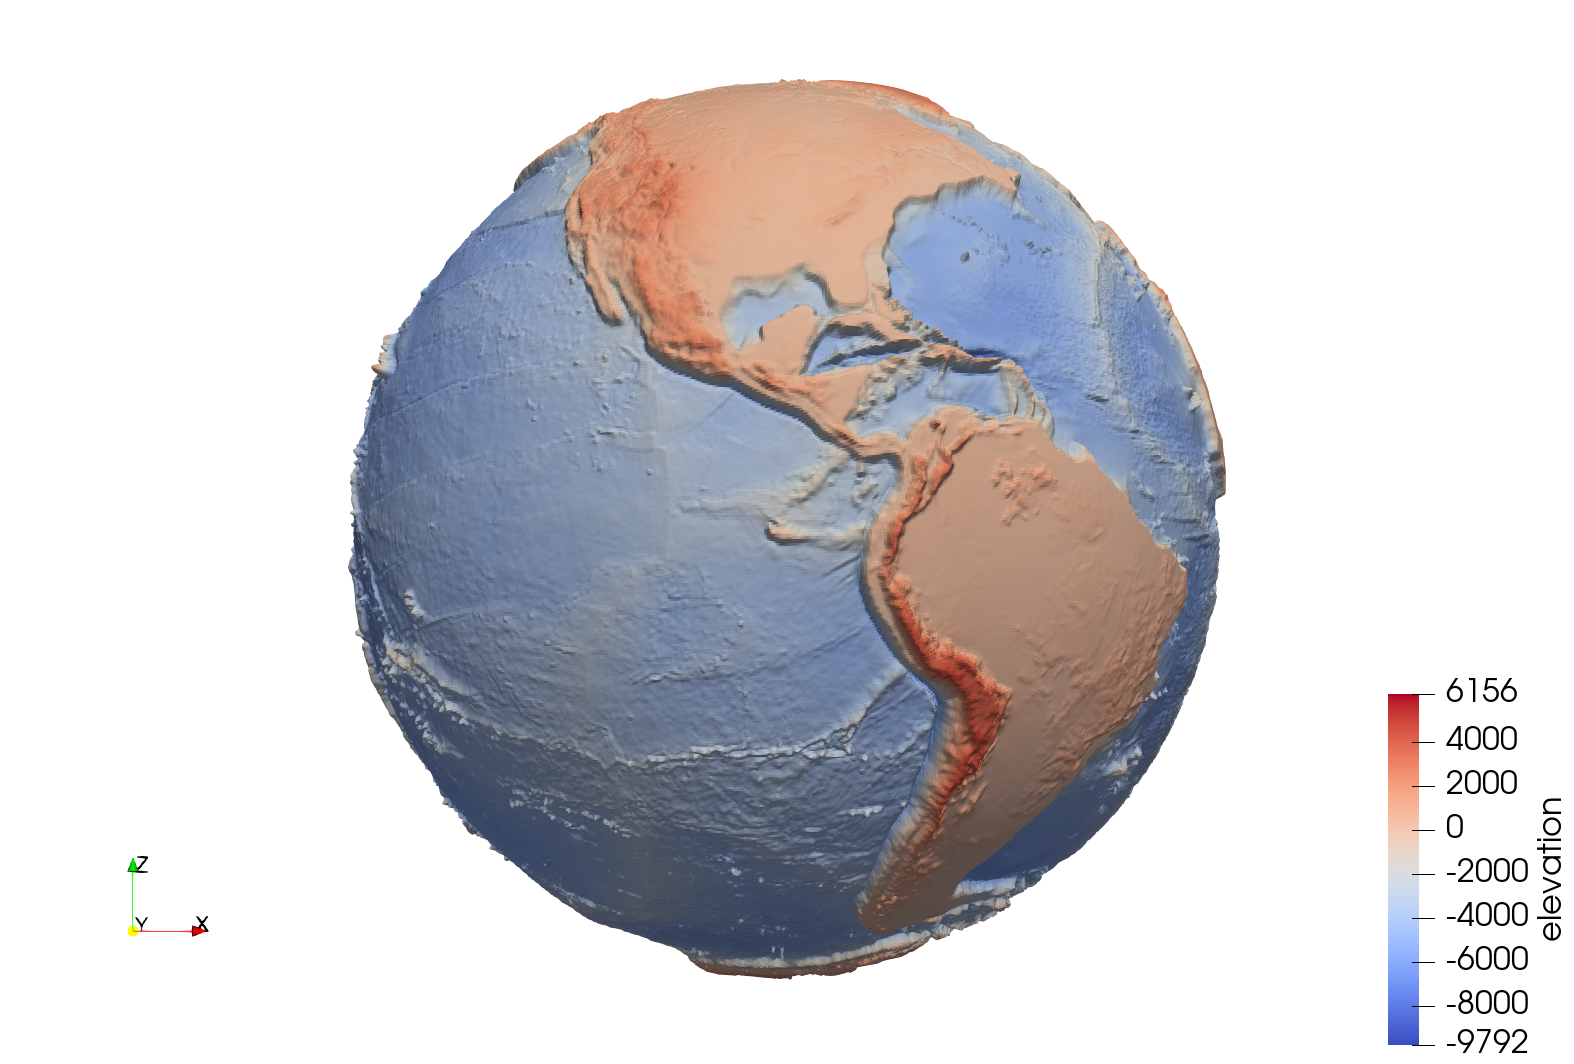
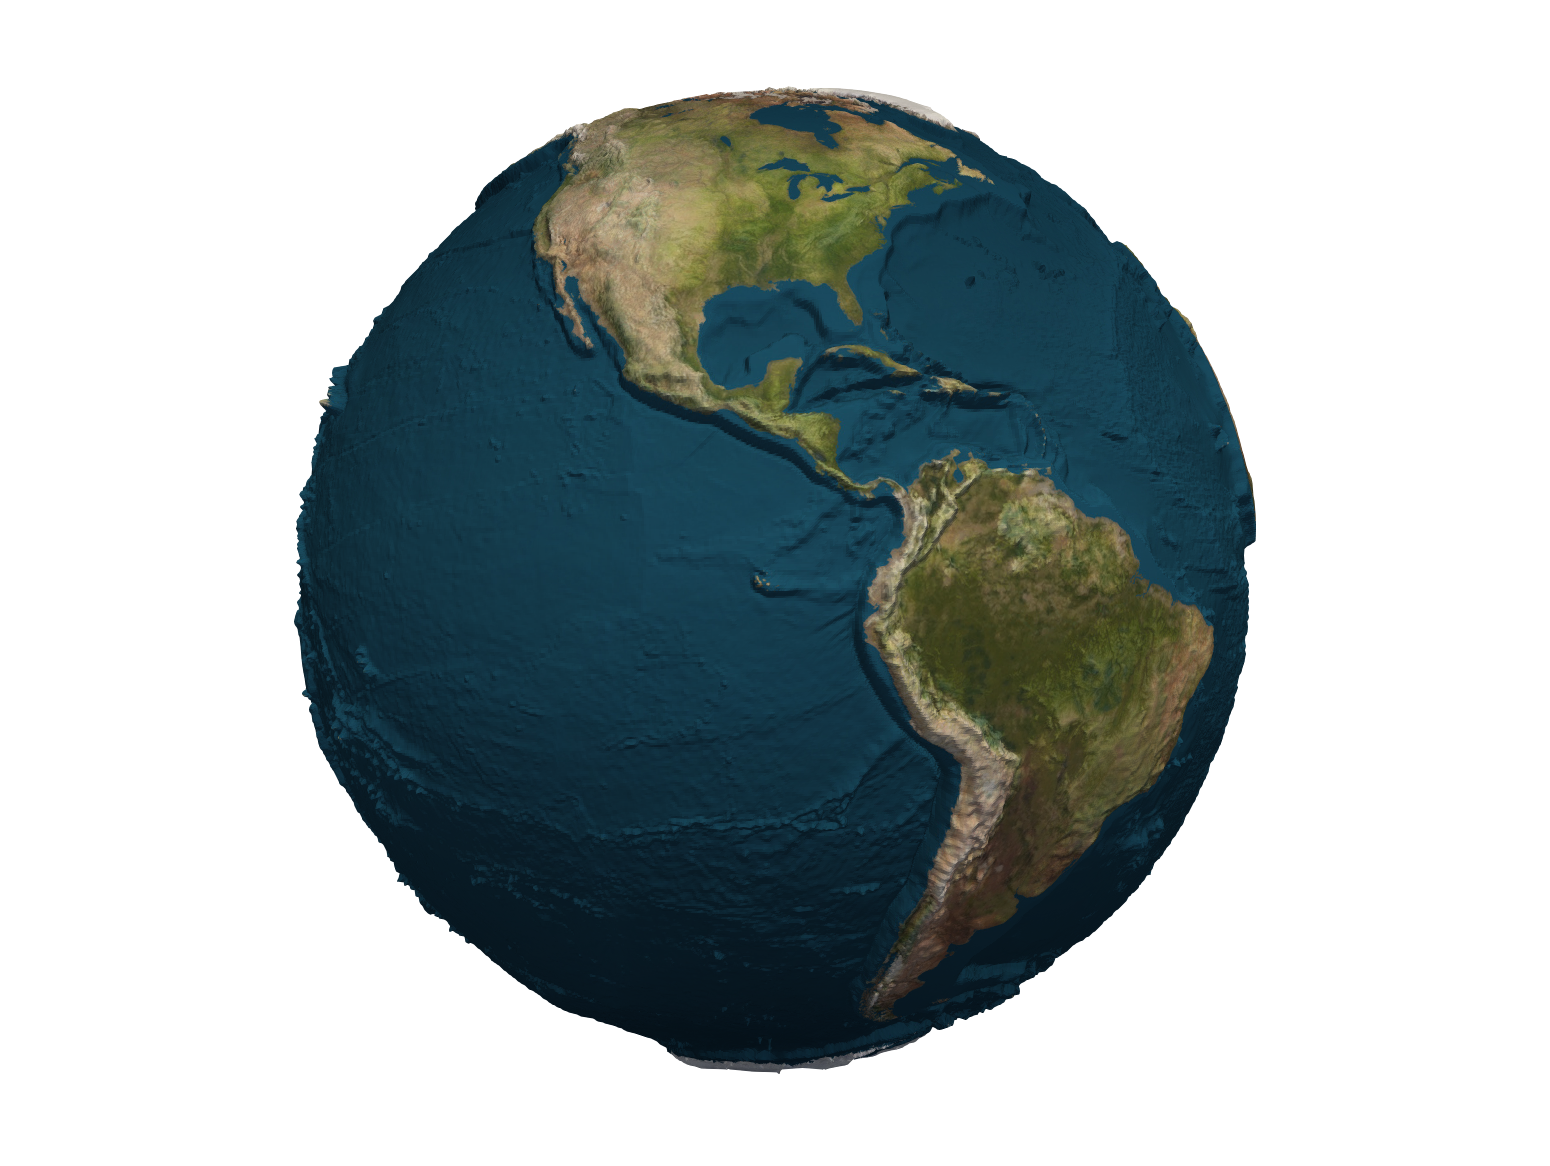
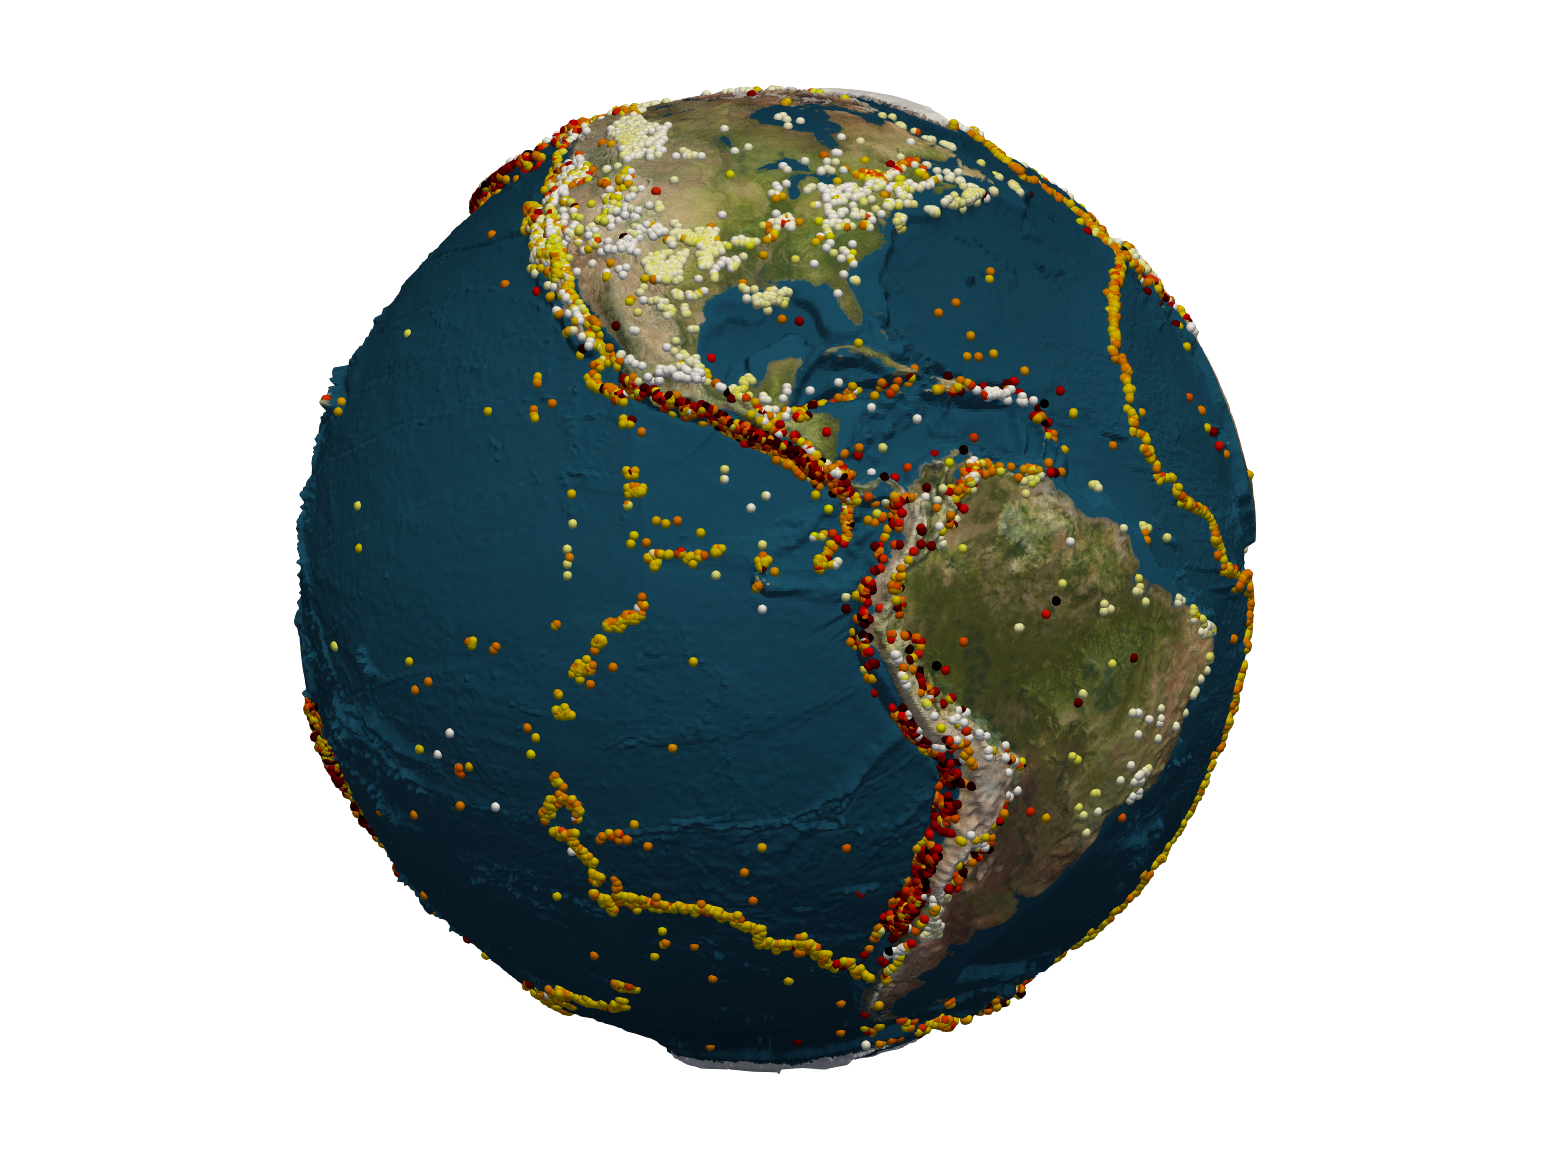
Show raster on globe way #2.
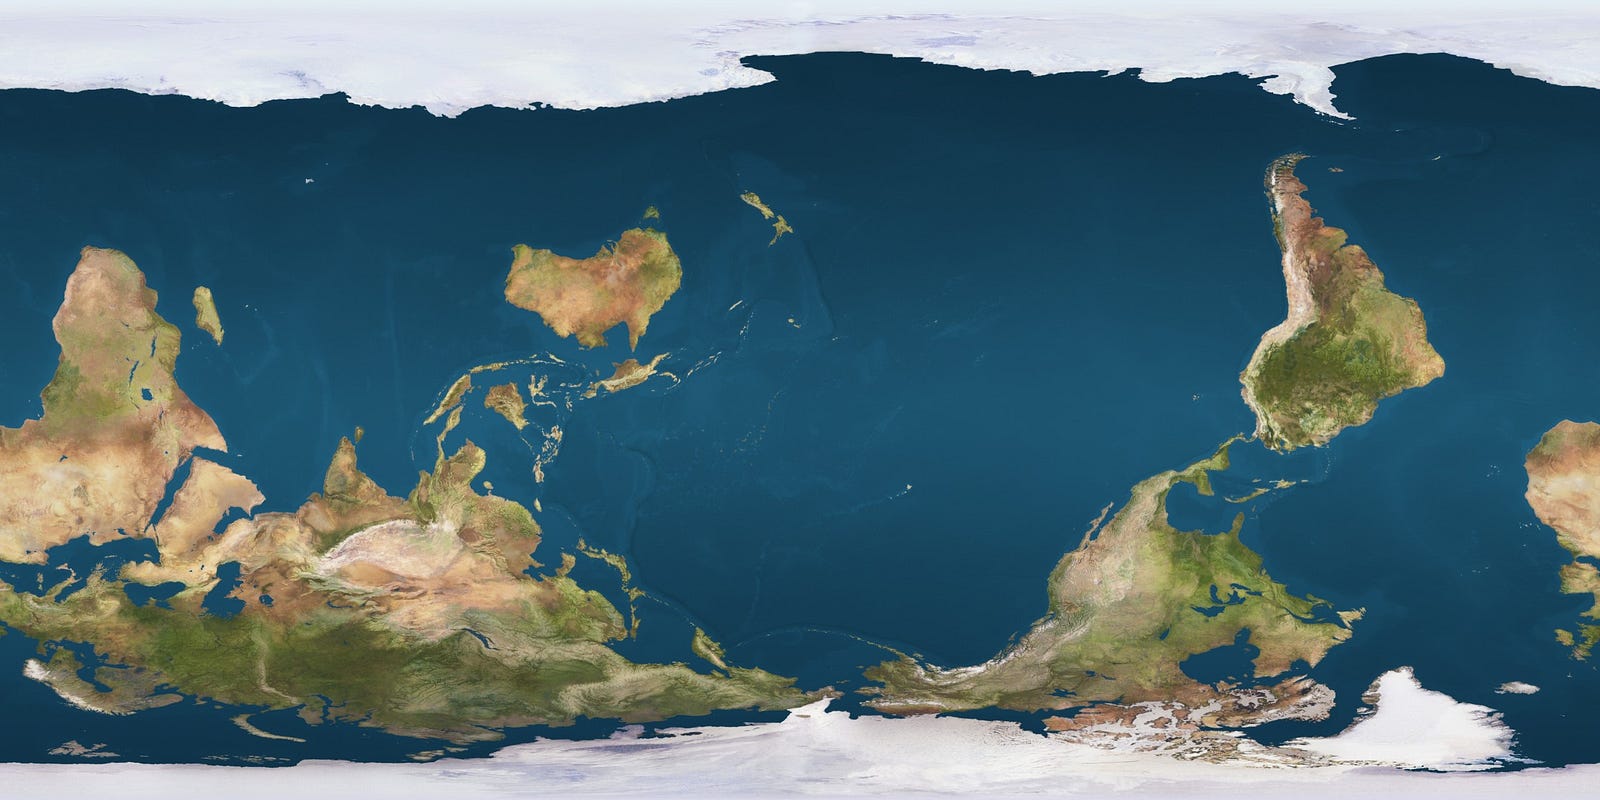
We use ParaView calculator expression for planar to spherical coordinates conversion
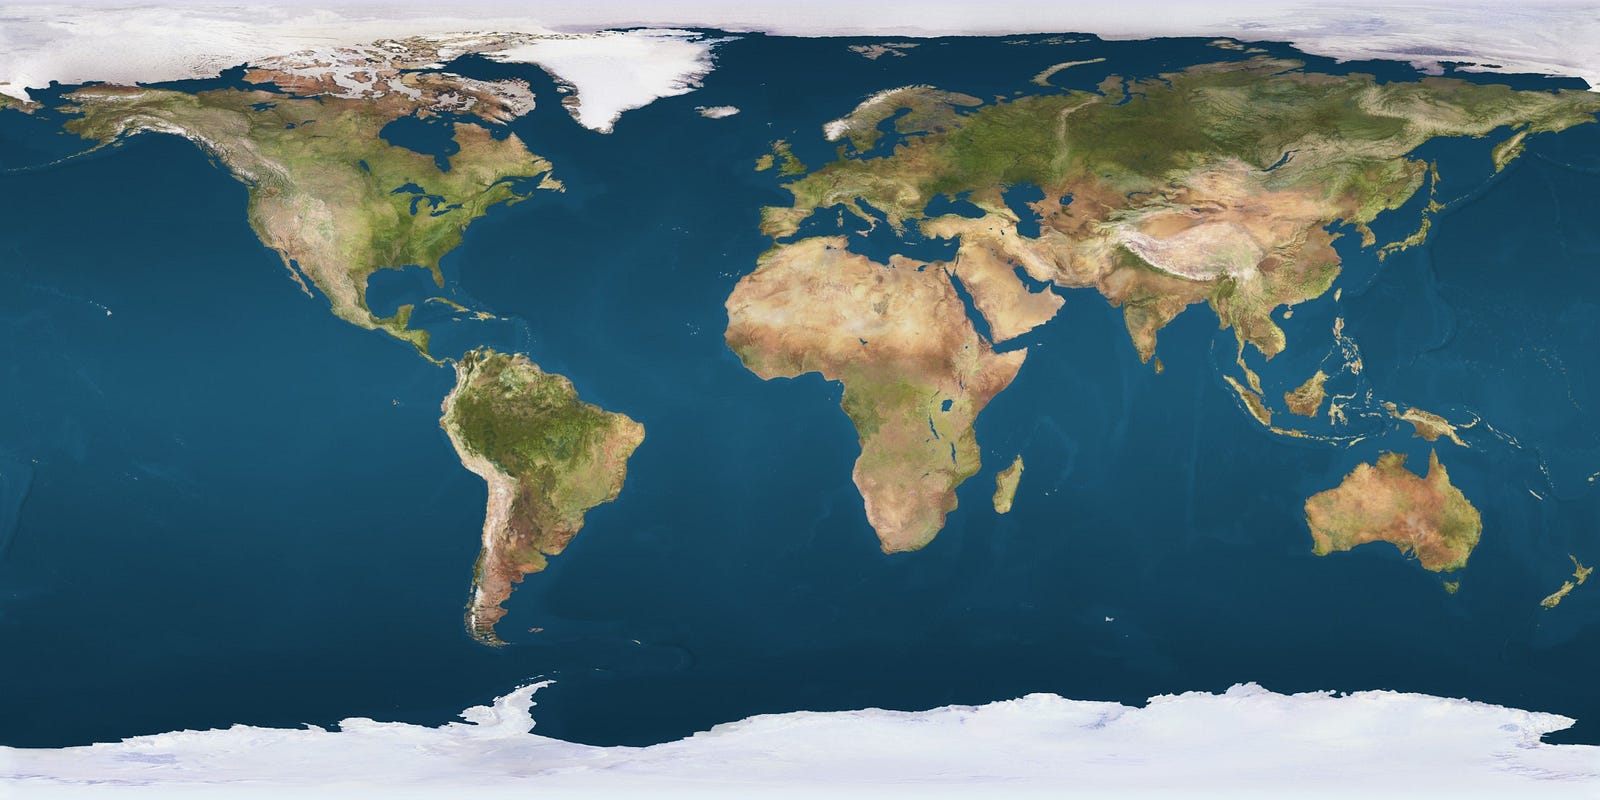
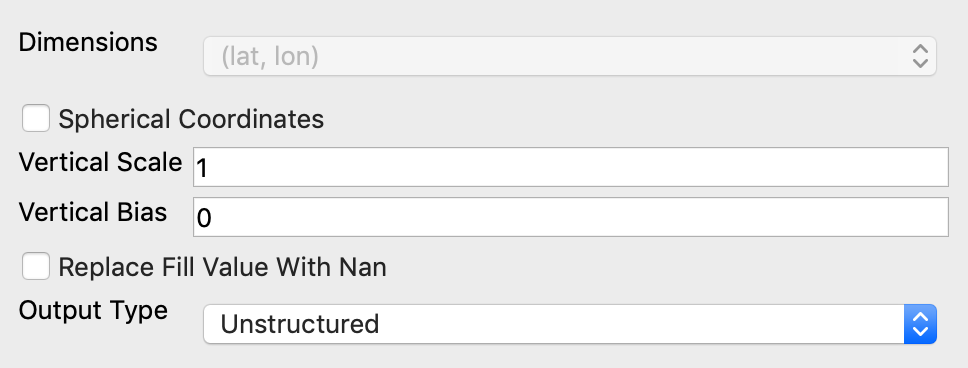
1.1. Load the data file GEBCO_2019.15min.nc in planar coordinates:
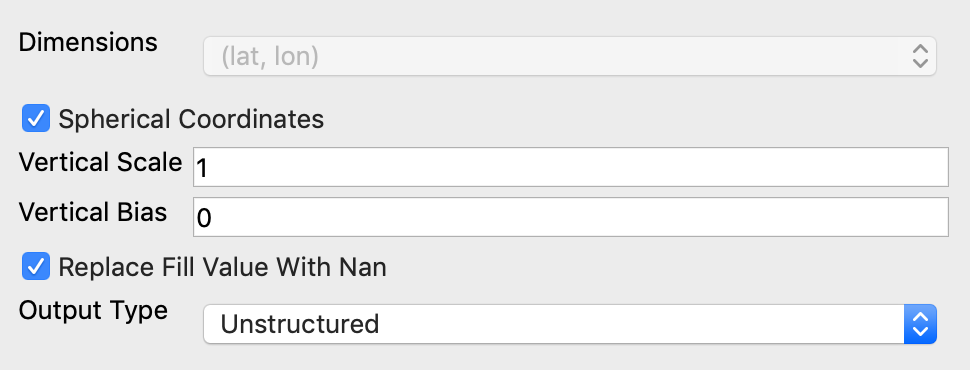
Note: “Output Type” option added in ParaView 5.8 and we need to specify it correct for the future calculations.
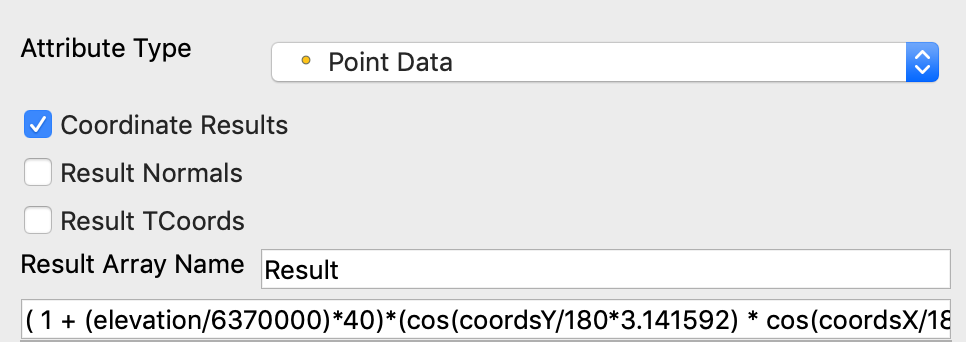
1.2. Add “Calculator” filter with this expression:
Задачки у меня бывают разные, кратенькое описание того, что может потребоваться я приводил здесь: Софт для спектрального анализа/численного моделирования/etc. Дело происходит в Linux Debian, соответственно, интересует софт, который устанавливается из стандартного репозитория (что подразумевает опенсорсность). Для начала я протестировал двумерное Фурье преобразование (прямое и обратное) на широко известном тестовом изображении Lenna. Заодно в процессе поиска нужных функций увидел заметки об истории этого изображения Просто Лена и Обработка изображений: кто такая Лена Выбор софта для такой типичной задачки вполне себе наличествует: Scientific Computing with Free software on GNU/Linux HOWTO Пакеты прикладных программ Инструменты визуализации данных для Linux На практике же оказалось не так радужно, как хотелось бы. Из того, что есть в дебиане, работает "из коробки" только пакет octave . Зато для него можно установить множество ра...
Link: https://www.linkedin.com/pulse/why-gravity-correction-latitudefree-airbouguerterrain-pechnikov/ Traditional geophysics uses a set of corrections (reduction) for the observed gravity measurements (https://en.wikipedia.org/wiki/Bouguer_anomaly). But what they mean? In terms of common physics these are just products of spatial bandpass filtering. However geophysics still based on these rough coefficients instead of using spatial bandpass filters. That’s really nonsense when these common tables of coefficients applied to high-resolution data observations! As example we have subcentimeter accuracy and ~100m spatial resolution of altimeter satellite measurements to calculate gravity on the sea surface level. In fact the table-based corrections are only tribute to traditions and these are absolutely useless. Let’s use spatial filters to extract the anomalies of all spatial scales.
Comments